
The Buffett Indicator is not a set of absolute criteria, and we shouldn’t apply its rules of thumb to the Philippines without much thought. The best application is indeed when we understand its purpose. And that is to look for signs of undervaluation or overvaluation based on market capitalization and output.
The analysis here uses 20 years of historical data to compute for buy- and sell- thresholds based on the Buffett Indicator, adjusted for the PSE (specifically the Philippine Stock Exchange Index, or PSEi).
(Related: FMETF: The Smart Way of Investing in the PSE Stock Market)
(The contents of this post are beginner-friendly but may still cover some intermediate/advanced finance topics. Should you find them confusing, I recommend starting with the Fundamentals of Personal Finance.)
Page Contents
An overview of the Buffett Indicator
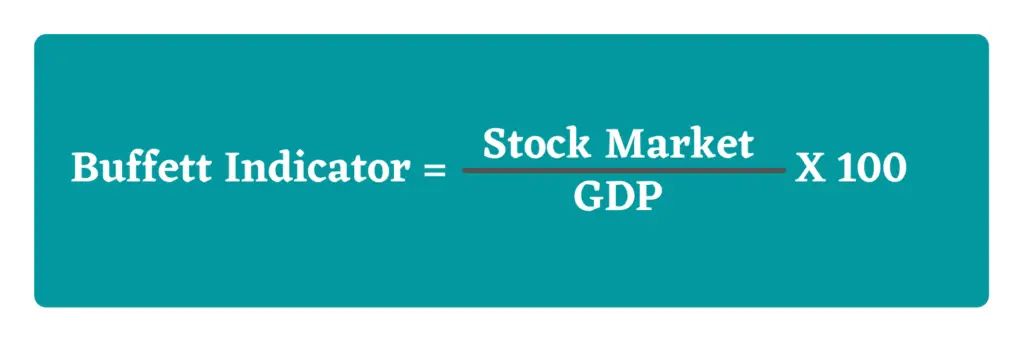
The Buffett Indicator is a measure to monitor the Stock Market Capitalization against a country’s GDP.
This assumes that an index (of the country’s top corporations) sufficiently captures the overall stock market movement. We then compare this market movement to the actual output or production (GDP) of the country.
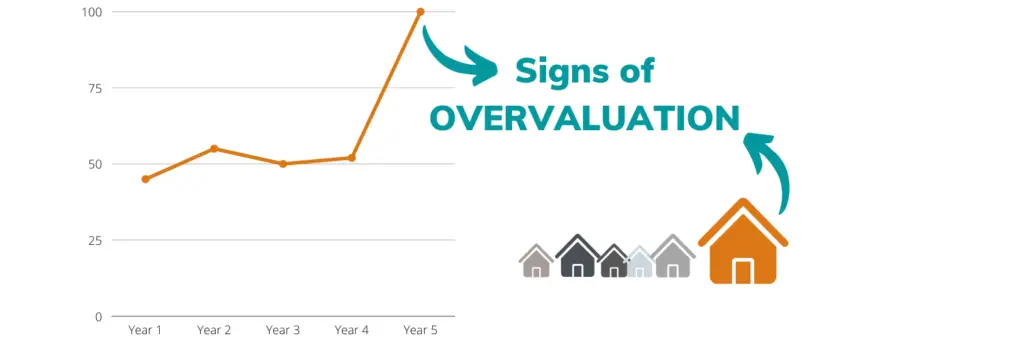
A high number means stock prices are high relative to a country’s production. A low number means stock prices are low relative to a country’s production. We’ll discuss what high or low numbers are in a bit.
What’s an index

An index in finance is a hypothetical collection of securities meant to track the performance of a specific field. These fields can be as broad as the entire stock market, such as the All Shares PSE, or as specific as a particular industry such as the PSE Industrial Index. An Index Summary is found on PSE’s website.
Indices can be computed in a variety of ways. Equally-weighted, price-weighted, and capitalization-weighted are some of the most common computations.
The PSEi is a capitalization-weighted collection of 30 stocks meant to track the overall performance of the PSE.
Investors don’t directly invest in an index. Instead, there are funds that track the index. These funds involve less management, as it rebalances the portfolio to mimic the index, and therefore have lower fees. But it’s also worth saying that there may be tracking differences between the fund and the index it’s tracking.
Rules of thumb: Undervalued, fairly valued, overvalued
The prevalent index used by analysts for the Buffett Indicator is the Wilshire 5000 Total Market Index. Like the PSEi, this is also a capitalization-weighted index.
The Wilshire 5000’s mandate is to track the overall performance of the US stock market. Analysts using the Buffett Indicator divide this by the US quarterly GDP, with the following rules of thumb:
- 50% to 75%: signs of undervaluation
- 75% to 90%: signs of fair valuation
- 90% to 115%: signs of overvaluation
The case for using an adjusted Buffett Indicator for the Philippines
Instead of a copy-paste approach of the Buffett Indicator to the Philippines and its stock market, there are valid arguments to using a modified indicator. The premise remains true to Warren Buffett’s message, but with adjustments to the buy- and sell- rules to fit the Philippine stock market.
Here are my arguments for using an adjusted Buffett Indicator for the PSE.
The Buffett Indicator is a price multiple
Common price multiples include the price-to-earnings ratio, price-to-book value ratio, price-to-sales ratio, price-to-cash flow ratio, and so on. The Buffett Indicator is essentially a price-multiple, where the stock market represents the price that investors are willing to pay for every unit of GDP.
And as with all price multiples, the best strategy is not to apply hard-and-fast rules, but rather to compare the price multiple across time or across comparables.
In other words, instead of saying “100 is a sign of overvaluation,” the best application of a multiple is to compare it over time, or compare it against similar multiples.
- Comparing over time:
- If the historical multiple of the index has been 200, then we might say 100 is cheap.
- If the historical multiple of the index has been 50, then we might say 100 is expensive.
- Comparing across comparable multiples:
- If similar multiples are at 200, then we might say 100 is cheap.
- If similar multiples are at 50, then we might say 100 is expensive.
The rules of thumb are based on US data

The rules of thumb (above) were made based on a US index and US data. Carelessly applying the same rules to another country could be wrong.
The Wilshire Index holds over 3000 stocks and is a very broad collection of companies. The PSEi, although likewise a capitalization-based index, only holds 30 companies.
Sure, that may be a moot point considering the equally discrepant sizes of the US and Philippine economies. But we should also consider the different starting points, and therefore ratios and growth rates, of both indices and economies.
It’s highly unlikely that the price-to-output ratios of both countries and economies match each other.
Now, using these rules of thumb may be acceptable proxies, and I don’t doubt that. But I’d also argue for a modified Buffett Indicator because we have historical data to do a backtest that’s specific to the PSE and PSEi.
We have actual data to work on
Instead of applying these rules of thumb to the Philippines or any other country, we can instead check on what the historical data tells us.
The process uses the PSEi as a proxy for the stock market capitalization (numerator), with the quarterly GDP of the Philippines as the denominator.
Every quarter, the Buffett Indicator with PSE-specific adjustments is computed as:
PSEi Level / GDP of Previous Quarter in millions x 10,000
Actual data is more likely to give better rules than a standardized set of buy- or sell- rules. Using a financial model with variable buy- and sell- thresholds, I used an optimization function to check the buy-threshold and sell-threshold that would’ve maximized our portfolio’s returns from 1998 to 2019.
Performance of the adjusted Buffett Indicator in the Philippines (PSEi)
A backtest of a hypothetical portfolio would’ve earned 19% p.a. in the Philippine Stock Market using the following buy-threshold and sell-threshold.
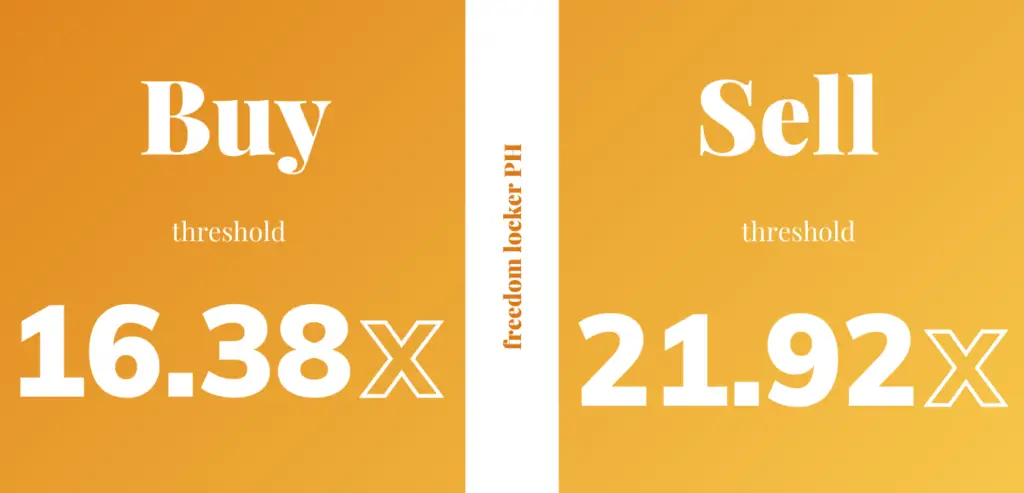
Under the assumptions made in the study, the following rules were followed by our hypothetical portfolio. They’re based on the Buffet Indicator (BI), adjusted for the Philippines (PSEi):
- Buy an index fund whenever the adjusted Buffett Indicator is 16.38x or less
- Sell the entire portfolio when the adjusted Buffett Indicator hits 21.92x or more
- Hold the portfolio in between thresholds (i.e., between 16.38x and 21.92x)
The assumption also includes selling the portfolio over a maximum holding period of 7 years. I used this arbitrary assumption to simulate the maximum holding period of an average investor.
(I made my original study in January 2020. It includes data from January 1998 to December 2019. If you want to know more about the study, please read through How to Earn 19% in the Stock Market, Philippines.)
Recommendation as of May 2021
Based on the most recent available data, I used a Philippine Quarterly GDP of Php4.35 trillion.
The PSEi level, as of this writing, is 6,229.
This gives us an adjusted Buffett Indicator of 14.33x.
Based on the computed thresholds, this quarter is a “BUY” quarter for me.
For the latest news on the adjusted/modified Buffett Indicator for the Philippines, please consider subscribing to our newsletter and following me on Instagram.
Please also note the potential tracking differences between the index fund of your choice and the PSEi. I am also simply sharing my strategy. This is not meant to be a recommendation that’s specific to you. This opinion is based on original research and is my interpretation of the optimal application of the Buffett Indicator to the Philippines. (See the Terms & Conditions of this site.)
Read more, select a topic:


Hi Dan – how come you are comparing the latest index vs the quarter GDP? Shouldn’t GDP be annualized?
Hi Marc, good catch! You are correct that the index is essentially a price of the market, so annualized GDP makes sense if we use P/E as an analogy. Although, the P/E analogy is imperfect anyway because GDP accounts for a lot more than just the companies in the index.
So 2 things as to why I chose quarterly: (1) I wanted a portfolio that adjusted quicker, and (2) it made sense to me from a practicality standpoint. That doesn’t make it right or wrong. Just a preference.
Also, unlike the income approach in valuation where the numerator cash flows ought to match the denominator discount rate (e.g., FCFF and WACC vs. FCFE and Cost of Equity), there are no exact rules to relative valuation multiples. Instead, it is up to the user/analyst to find signals that make sense — and these are always debatable. So while the trailing twelve months is typically the denominator, it doesn’t have to be as long as you’re consistently comparing apples to apples and you do it with some rationale.
The resulting index-to-last quarter’s GDP is essentially a ratio that only makes sense when compared across time. On its own, it doesn’t have meaning. Neither will the index-to-annual GDP, on its own, have meaning. And quarterly monitoring will mean quicker adjustments in signal, kind of like how a 7-day average moves quicker than a 30-day average. Again, not right nor wrong. Just a preference because economic cycles are declared in quarters (e.g., recessions are 2 straight quarters of negative GDP growth).
In the 20-year backtest I did, I wanted to know, “With new information on the last quarter’s GDP, and given the current index level, should I buy the market?” I could’ve applied a rolling GDP of the past year or some other GDP measure, but it would’ve made the model unnecessarily complex (admittedly my fault) when a simpler model, applying the Pareto principle, fairly suffices.
Though I’d be interested to see the results of a backtest with annual GDP. But since my study was on index-to-last quarter’s GDP, I use that ratio as my signal moving forward. Hope that makes sense!