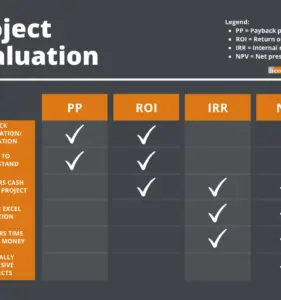
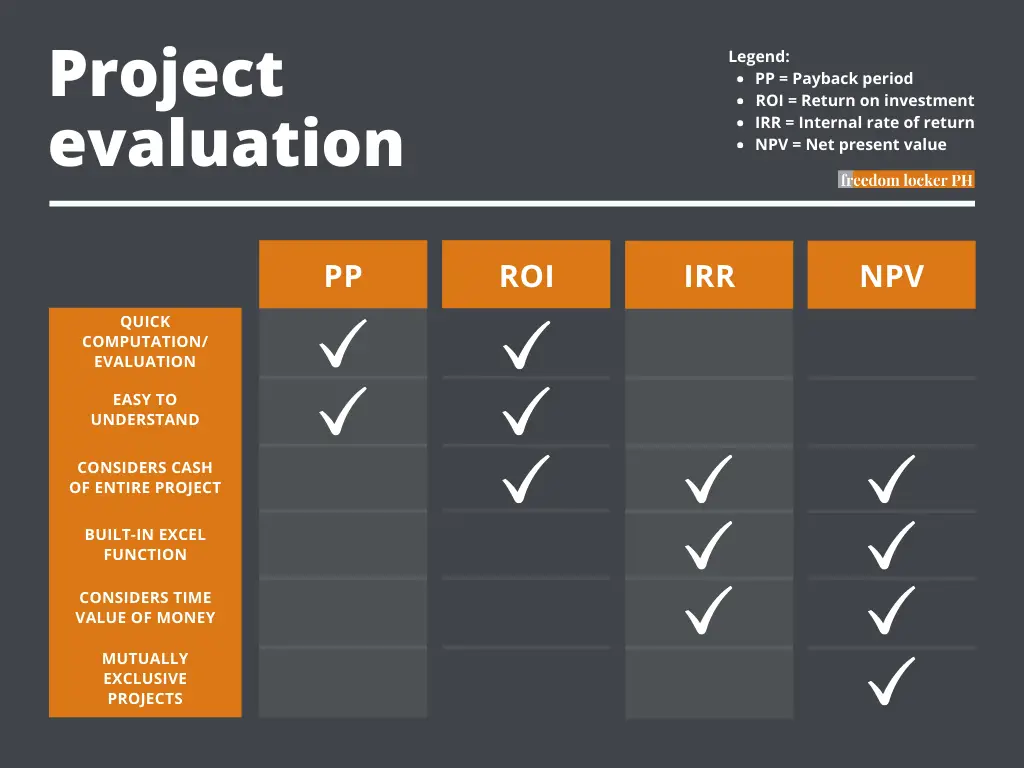
It’s not unusual for business owners to evaluate projects based on two well-known tools: the payback period (PP) and the return on investment (ROI). Both certainly have merits. They are easy to calculate and understand, and business owners and managers are able to avoid losses or grab opportunities in a snap. But these performance measures are, sadly, inferior tools when compared to the internal rate of return (IRR) and net present value (NPV).
I hope I don’t come across as someone opposing payback period and ROI. In fact, I like how they’re accessible enough for most to see financial analyses in an uncomplicated light. The appeal is in their simplicity. But for the advancement of our entrepreneurial journey, just knowing that some approved projects may not always be the best, and vice versa, is good enough. We will continue to use PP and ROI for sure, especially for some template projects, but having this awareness is nevertheless invaluable.
(But I’d also argue that large corporations should always use NPV. This was the method we used in corporate planning and analysis.)
Page Contents
The need for project evaluation
There is a need for project evaluation because of scarce resources. A business should certainly accept only profitable projects, but profitability is not the be-all and end-all. For one, a profitable business with cash flow problems can be forced to shut down (follow up post on “profitability vs. cash flow” here). Another is that comparability between two profitable projects becomes more challenging with differing characteristics.
For example, due to budget constraints, an entrepreneur or manager needs to choose between two profitable projects. The two projects have different cash flow patterns, balloon-type vs. equal-payments, and also differ in scale. This is where a project evaluation tool comes to play.
It guides the owner or manager as to which project(s) to pursue.
Payback-period and ROI explained
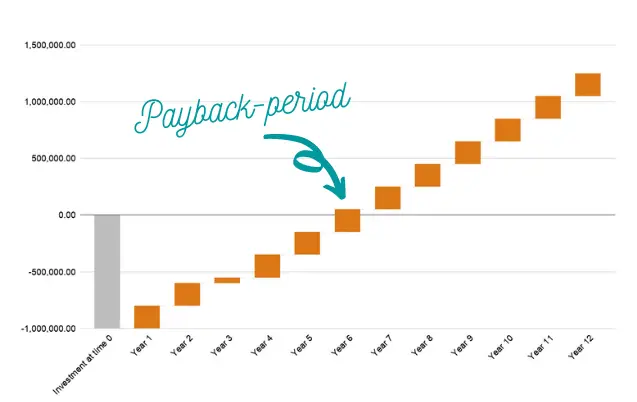
Payback-period
The payback-period is how long it takes to recover the investment. If a project costs Php1 million and the expected after-tax cash inflow to the business is Php500,000 per year, the payback period is 2 years. We naturally prefer lower (faster) payback-periods.
Annual and monthly terms are the expressions we use for payback-periods. Someone might say “I’ll accept a project if I can recover my investment in 60 to 72 months” or something to that effect.
Return on investment
The return on investment expresses a project’s returns as a proportion to its costs. It is calculated by getting the project’s benefit and dividing that by the project’s costs. The resulting percentage is the ROI. For multi-year projects, we get the annualized ROI.
Example, if a project costs Php1 million and the after-tax cash flow in one year is Php200,000, then the ROI for year 1 is 20% (Php200,000 / Php1 million).
(Related: Finance for people who hate math – I touch on percentages and time value of money in this post.)
Drawbacks to using PP and ROI
Both of these tools fail to consider the time value of money.
In the case of the payback-period, this measure completely fails to consider cash flow AFTER the payback period. This can be significant and may be enough to tip the balance in favor of, or against, this project.
Consider two hypothetical projects X and Y, with payback periods of 5 and 6 years, respectively. Assuming project Y is able to generate cash of any significant amount for 10 years or more, it may probably be enough to make project Y the preferred project.
By not considering the time value of money, you’re actually losing money from the opportunity cost associated with not holding the money now. Because time value of money is a real phenomenon, the analyses based on PP and ROI are, for lack of a better word, flawed, to begin with.

Introducing the IRR and NPV
IRR and NPV are superior tools in assessing competing projects because they account for the time value of money component. The net present value (NPV) method discounts all future cash flows back to today’s terms and sums everything up. (Sorry but again, time value of money is here.)
If NPV is greater than zero, it means the project is adding value to the business. The value added to the business is the amount of the NPV. NPV has a lot of advantages but this is not the post to go in-depth on its merits. (Are you interested in a post covering NPV in detail? Please leave a comment if you are.)
IRR is the discount rate that yields an NPV of zero — sort of like a break-even point. (Related: Assess business viability with this formula (BEP))
We also use it as a break-even point. Any project that yields an IRR higher than the required rate of return is an “accept/pursue” project. A higher IRR is preferred.
It’s also worth noting that spreadsheets like MS Excel and LibreOffice Calc (free business tools) have built-in NPV and IRR functions. They might not be as inaccessible as you thought.
IRR vs. NPV
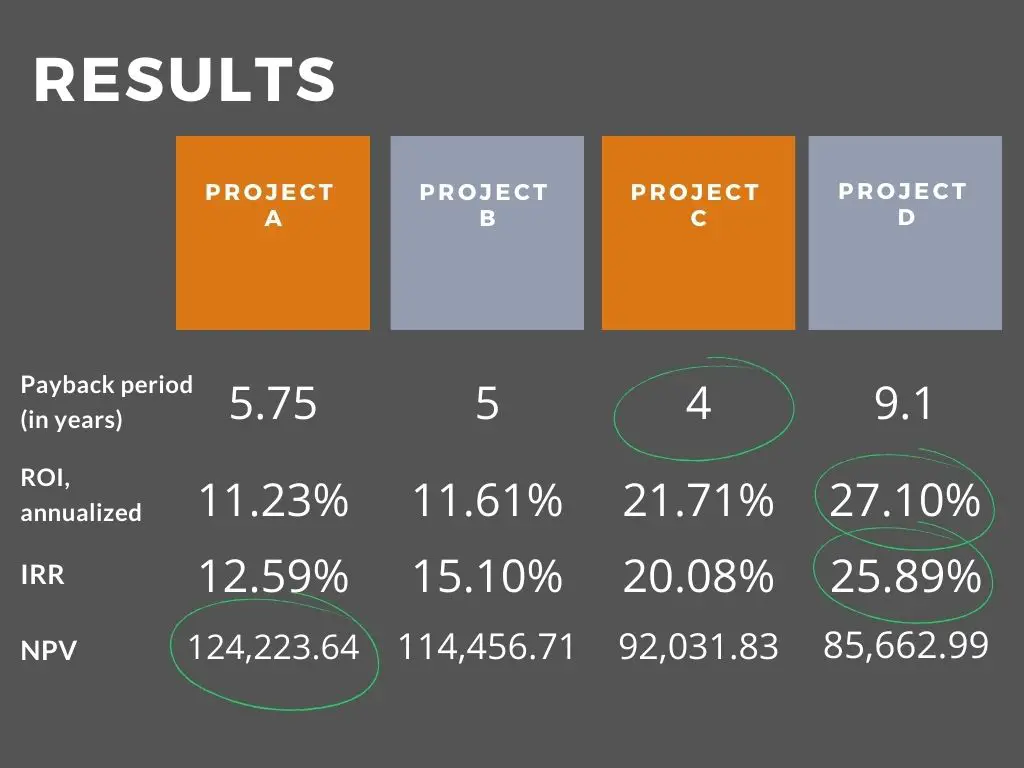
IRR and NPV give consistent results unless the pool of available projects are mutually exclusive — meaning if you pursue one project, you can’t pursue the others.
For example, if a company has a budget of Php1 million and the two available projects cost Php1 million each, then these two projects are mutually exclusive. In contrast, if both projects cost Php500,000 each, then they might not be mutually exclusive.
(Emphasizing “might” because there are other factors that cause mutual exclusivity. A coin toss is another example. “Heads” and “tails” are mutually exclusive events.)
For conflicting results, the NPV is preferred. It’s represented in actual money added to the business; the reinvestment assumption is conservative relative to IRR’s reinvestment assumption; it allows for changes in the discount rate per year.
(Again, this might not be needed information for our purposes. Investopedia also has a good overview of the differences between the two. But leave a comment below if want a more detailed post discussing this.)
A final word on ROI and payback-period
Like I said in the beginning, I hope I don’t come across as someone opposed to ROI and PP. In general, assessing projects with conventional cash flows, similar time horizons, and similar sizes should be fine. As an accessible tool, payback-period and ROI allow action rather than inaction. I believe NPV is the superior performance measure and will continue to use NPV in evaluating all future projects, but I also understand that:
progress is better than perfection.
Probably best to remember their flaws — and know when they’re relevant. But if ROI and PP are tools that help you progress, then they’re the perfect tools.
Read more, select a topic:


