
I made a promise not to post about fluff topics for clicks. (See What is your WHY) But I’d be remiss not to post about how I invest in the Philippine stock market. How to earn in the stock market, in the Philippines and beyond, comes in many ways — from capital appreciation to dividends; from short-term day-trading to long-term value investing. I backtested over 20 years of PSE data and found my Rules of Thumb. When tested on historical data, these rules allow a portfolio to earn around 19% per year.
Sharing this information doesn’t have an impact on my portfolio but I hope it serves a greater audience in achieving financial freedom. And no, you will not achieve financial freedom just by following these rules. (See Monthly savings will NOT lead to financial freedom) But it does allow your money to work harder.
Please remember that this is my approach and I am not saying this is how you should invest. Know more about our Privacy Policy.
This post may cover some intermediate/advanced topics. If you find them confusing, I recommend starting with the Fundamentals of Personal Finance.
Page Contents
Why day trading is not for me

18% is a lot more than the 10% average return of a purely buy-and-hold or cost-averaging strategy. It is though, a lot less than what some day-traders make. (Emphasizing “some” because I bet a lot have lost even more to day-trading.) My approach falls in the long-term investing strategy rather than scoring quick wins. I prefer to use this method for a few reasons:
#1: Trying to look for undervalued stocks is a full-time job
freedom locker PH is a repository for people wanting true financial freedom. In a nutshell, having a job is not something we aspire for because it takes away from our freedom of time. You stop earning when you stop working.
And I can surely attest, as someone with years of experience in business valuation, that looking for undervalued stocks is a full-time job.
#2: I’ve tried and failed at it
Estimating a stock’s intrinsic value isn’t a sure-fire way of earning in the stock market either. Emotions play a huge role and the market’s sentiment doesn’t care about your feelings. Even if you’re a technical analyst (i.e., someone who doesn’t care about intrinsic valuations, but is rather aware of patterns and sentiments), emotions may unknowingly affect you. (See Lessons from Thinking, Fast and Slow)
Most people have your exact same information and relying on news articles seldom results in profitable moves.
(Related: 5 Reasons Why I Don’t Read the News on Stocks)
Here’s a favorite quote from Howard Marks’ book, Mastering the Market Cycle, an illustration of skewed interpretations by his friend Jon Brooks.
- Oil spikes: growing global economy contributing to demand — stocks rally
- Oil drops: more purchasing power for the consumer — stocks rally
The stock market moves with the market sentiment’s swing, regardless of valuation. Analysts will believe what they want to believe, regardless of data. And their beliefs are unknowingly plagued by emotions.

I’ve experienced the highs and lows. In eToro, I experienced profiting $400 in less than a minute, only to lose $500 some other day. Having said that, eToro is an easy way to gain exposure to international markets and still invest long-term. Right now I use eToro for exposure to a few commodities.
(Related: Interactive Brokers from the Philippines: Waived Fees, Funding, and More)
In the end, the risks to me are not something I’m willing to take. You can achieve financial freedom through day-trading, I don’t doubt that. But it’s not a path I would choose, just because there are other more protected routes.
#3 Warren Buffett believes in the power of an index fund
Warren Buffett famously placed a bet that a regular index fund could beat the returns of a hedge fund.
He won $1 million.
An index fund is a basket of selected stocks representing a mandate. The PSEi, for example, is an index that tracks the performance of 30-selected companies in the Philippines. The idea is that these 30 stocks capture the total market movement of the PSE. Investing in the PSEi index (in a Mutual Fund, UITF, or ETF that tracks it) is like investing in all 30 companies individually. Buffett’s strategy was to buy-and-hold the index.
A hedge fund is essentially a collection of analysts targeting higher-than-average returns for high net-worth individuals or companies. This is probably a poor definition, but the point is they’re a collection of individuals with fancy degrees and MBAs in the business of generating excess returns, employing even fancier equipment and technology. Needless to say, they don’t “just” buy-and-hold.
Warren Buffett believes that holding an index is a good strategy for unsophisticated investors like us.
(Related: FMETF: The Smart Way of Investing in the PSE Stock Market)
The Buffett indicator explained
I used the Buffett indicator in this hybrid strategy. It’s not exactly a buy-and-hold strategy because the method suggests a buy (or sell) order when it reaches a threshold. Let’s define a few points first.
Stock market price multiples
The Buffett indicator is similar to price multiples in stock investing or valuation. (See the market approach in A basic guide to the 3 valuation methods.) There are price-to-earnings multiples, price-to-sales multiples, price-to-book value multiples, and a whole slew of other multiples.
Let’s dissect the P/E multiple. P/E measures how much investors are willing to buy a stock knowing how much that stock earns in income. For example, a P/E of 10x means investors are willing to shell out 10 times the amount a company generates in earnings. A company priced at Php100/share with earnings of Php10/share has a P/E multiple of 10x. Another company priced at Php1,000/share with earnings of Php100/share also has a P/E of 10x.
There are no hard-and-fast rules to determining a reasonable P/E, but just know that a higher number means investors are paying more for every Peso earned by the company. If earnings stay at Php10/share, but the company’s price increases to Php300/share, then investors are now paying 30 times per Peso earned by the company. Whether that’s excessive or not is debatable.
How this relates to the Buffet indicator
Buffett applies the price multiple concept on a country-wide level. He believes the market capitalization of a country’s stocks captures the price component (numerator). This is our PSEi. He also believes a country’s GDP captures the denominator component. The resulting multiple is basically what investors are paying per GDP output.
When the stock market index is high relative to GDP, the Buffett indicator rises and leans toward the overpriced spectrum– and vice versa. Think about it. When the stock market index (PSEi) rises, holding GDP constant, it means:
investors are paying more (for stocks) at the same economic output.
There are also no hard-and-fast rules in knowing if the stock market is overpriced, underpriced, or fairly priced. But the gist is this: A decreasing multiple means stocks are becoming cheaper — closer to a buy signal. An increasing multiple means stocks are becoming more expensive — closer to a sell signal.
This leads to the next question. At what range should you buy and sell?
Backtesting the signals in the PSE
In summary, these are the steps and assumptions I made.
(I’d be happy to get in touch with you here if you’re interested in discussing the exact procedure and model. But for a majority of the readers, explaining the process fully would’ve been overkill. Please feel free to skip to the final section.)
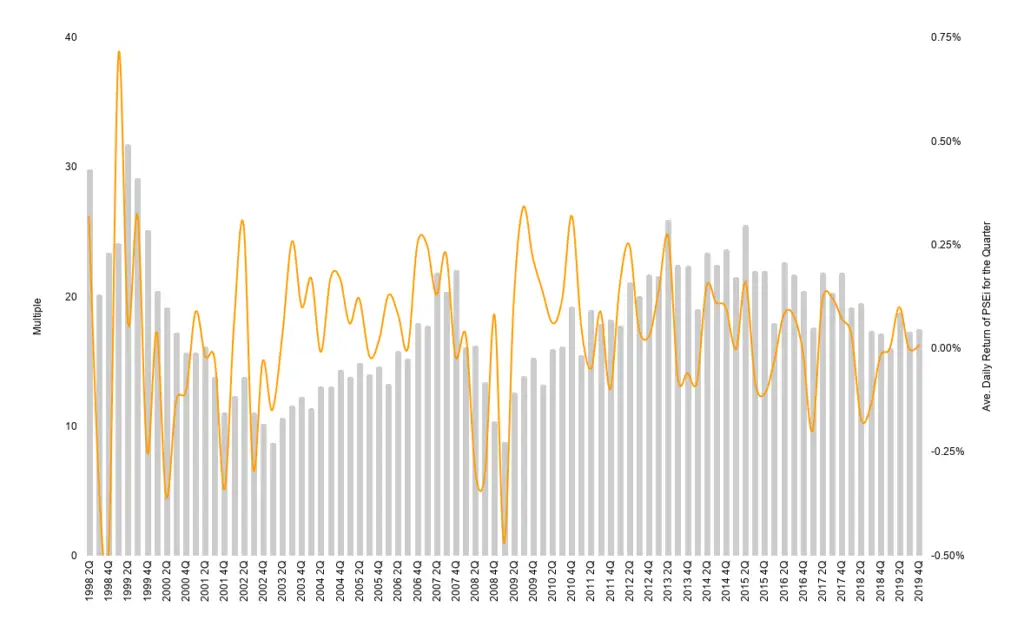
- I used the PSEi index as a proxy for the Philippines’ market capitalization.
- PSEi data is from the first quarter of 1998 to the fourth quarter of 2019.
- The data appears to be reasonably stationary but I did not test for that. In contrast, data on US indices such as DJI and S&P appear more non-stationary. The analysis assumes stationarity in PSE’s returns.
- There is a quarter lag between the PSEi and GDP. That is, this quarter’s market capitalization is divided by last quarter’s GDP. I think it makes buy and sell orders more realistic since that would have been the available information at the time of decision.
- I placed a 7-year cap on the holding period. This meant selling your holdings regardless of the multiple’s value if it’s been held for 7 years. Not surprisingly, a higher return would’ve been possible with a longer holding period. But I wanted a realistic portfolio and thought most people, due to liquidity needs, are able to hold stocks for only 7 years at most.
- I assumed an investment amount of Php30,000 for buy-quarters. It’s an arbitrary number I think a lot of people are able to set aside per quarter.
Backtesting rules applied to the stock market
I plugged these assumptions in the financial model and used an equation where a BUY order would’ve been made if the Buffet indicator was below a certain level — let’s call this threshold B.
A SELL order would also have been made if the Buffet indicator reached a certain threshold — let’s call this threshold S.
The last step was to use the optimizer function to maximize the ending portfolio value by changing the thresholds. In other words: Change B and S to get the maximum ending value possible.
Results
(If the entire post is too long to read, skip to this part.)
The portfolio’s value would have been maximized using these buy and sell thresholds:
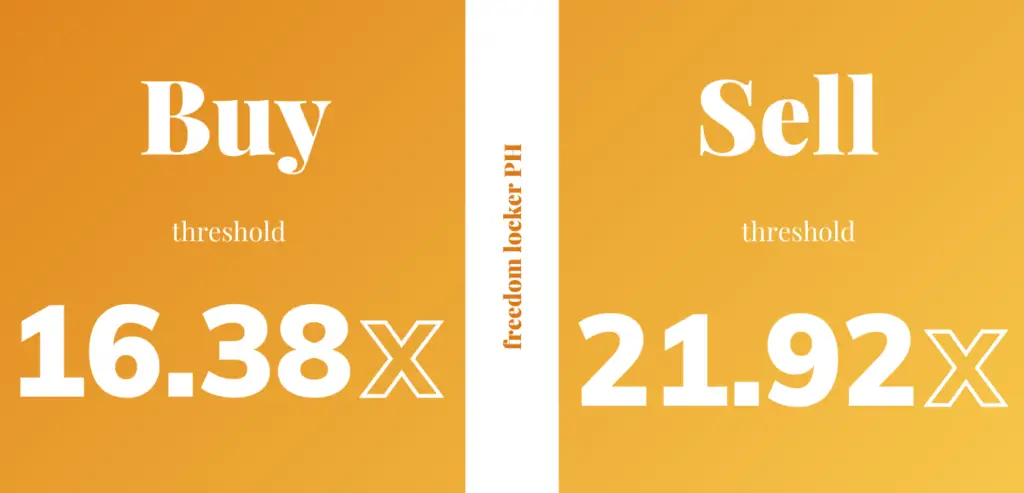
If there’s one thing to take away from this long post, it is this. Buy the index when the multiple is at 16.38x or lower and sell when the multiple is at 21.92x or higher. These are the steps I use to compute today’s multiple:
My modified Buffett Indicator
- Step 1: Get the PSEi level. This information is available on PSE’s website.
- Step 2: Get last quarter’s GDP. This information is available on PSA’s website (The Philippine Statistics Authority). You can find GDP under Statistics — Economic — Macroeconomic Accounts — National Accounts
- Step 3: Use this formula to get the Buffett indicator multiple:
PSEi Level / GDP of Previous Quarter in millions x 10,000
(Related: For the latest computation of this modified Buffett Indicator, see Buffett Indicator Philippines: Adjusted for the PSE.)
At Php30,000 for every “buy-quarter,” the total investment would’ve been Php1.11 million over 37 buying quarters. These are quarters where the multiple was 16.38x or below. Sell orders are ignored if the assumed portfolio had zero holdings; the entire portfolio is sold if the multiple reaches 21.92x. Fun fact: The data tells us the portfolio would’ve been sold in the fourth quarter of 2007 and in the second quarter of 2013.
In the end, our portfolio would’ve ended with a value of Php2.7 million and a weighted average return (quarter) of 4.44%. Average quarterly returns are computed as the rate of return needed to reach the ending amount over the given period at the assumed quarter investments. 4.44% per quarter compounded is 19% per year.
*Historical performance does not guarantee future results. The purpose here is to see how a portfolio with these buy and sell thresholds would’ve performed given historical data. Backtesting is a principle I fell in love with when I read Ray Dalio’s book, Principles. It’s a long read though. But well worth it in my opinion. You can get a copy of the book on Amazon. This is an affiliate link. You may read my affiliate disclosure on my Terms & Conditions page, #6 Links.
Read more, select a topic:


Been looking around for someone to explain valuation in the Philippine context, so am glad I found this. Thanks for sharing!
Absolutely my pleasure, Juan Doe! Please feel free to let me know if there are specifics you’d like to go in-depth on. I’m always looking for topics to write about. Thanks for the comment!